
Simple linear regression using Rstan--Rstan Wonderful R-(2)
數據 data-salary.txt是架空的。
某公司社員的年齡 \(X\)(歲),和年收入 \(Y\)(萬日元)的數據如下:
X,Y
24,472
24,403
26,454
32,575
33,546
35,781
38,750
40,601
40,814
43,792
43,745
44,837
48,868
52,988
56,1092
56,1007
57,1233
58,1202
59,1123
59,1314
年收入 \(Y\) 被認爲是由基本年收 \(y_{base}\) 和其他影響因素 \(\varepsilon\) 構成。由於該公司是典型的年功序列式的日本傳統企業,所以基本年收本身和社員年齡成正比例。 \(\varepsilon\) 則被認爲是由該員工當年的業績等隨機誤差造成的,但是所有員工的 \(\varepsilon\) 的均值被認爲是零。
g分析目的:
- 借用這個數據來分析並回答如下的問題:在該公司如果採用了一名50歲的員工,他/她的年收入的預期值會是多少。
Step 1, 確認數據分佈
Salary <- read.table("https://raw.githubusercontent.com/winterwang/RStanBook/master/chap04/input/data-salary.txt",
                     sep = ",", header = T)
library(ggplot2)

ggplot(Salary, aes(x = X, y = Y)) +
  geom_point(shape = 1, size = 4)  + theme(plot.subtitle = element_text(vjust = 1),
    plot.caption = element_text(vjust = 1),
    axis.line = element_line(colour = "bisque4",
        size = 0.2, linetype = "solid"),
    axis.ticks = element_line(size = 0.7),
    axis.title = element_text(size = 16),
    axis.text = element_text(size = 16, colour = "gray0"),
    panel.background = element_rect(fill = "gray98")) +
  scale_y_continuous(limits = c(200, 1400), breaks = c(200, 600, 1000, 1400))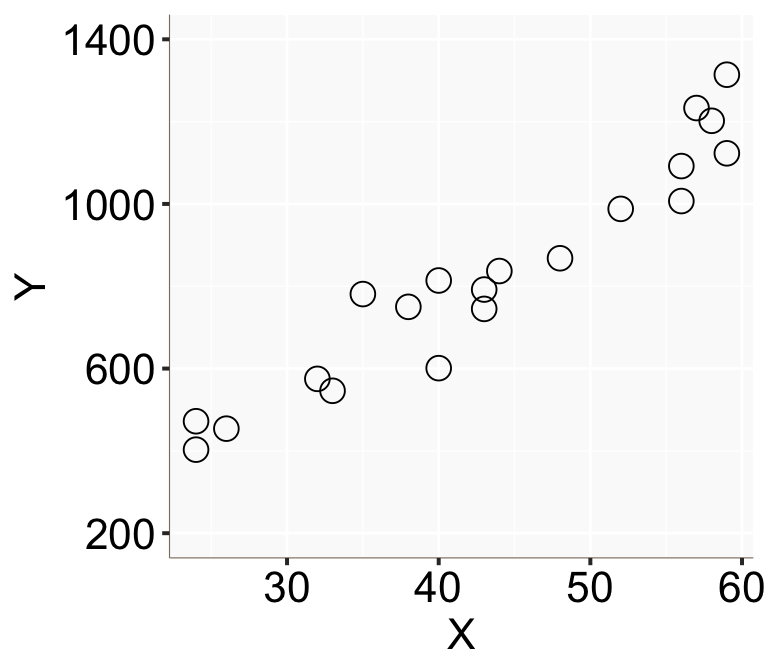
Figure 1: 橫軸爲 \(X\),縱軸爲 \(Y\) 的散點圖
從這個散點圖的特徵可以看出年收入確實似乎和年齡呈線性正相關。
Step 2, 描述線性模型
這個簡單線性回歸模型的數學表達式可以描述如下:
\[ \begin{array}{l} Y[n] = y_{base}[n] + \varepsilon [n]& n = 1,2,\dots,N \\ y_{base}[n] = a + bX[n] & n = 1,2,\dots,N \\ \varepsilon[n] \sim \text{Normal}(0, \sigma) & n = 1,2,\dots,N \\ \end{array} \]
同樣的模型你可以簡化描述成爲:
\[ Y[n] \sim \text{Normal}(a + bX[n], \sigma)\;\; n = 1,2,\dots,N \]
那麼如果一個統計師只有經過傳統概率論觀點的訓練,他/她會在R裏面這樣來分析這個數據:
res_lm <- lm(Y ~ X, data = Salary)
summary(res_lm)
##
## Call:
## lm(formula = Y ~ X, data = Salary)
##
## Residuals:
## Min 1Q Median 3Q Max
## -155.471 -51.523 -6.663 52.822 141.349
##
## Coefficients:
## Estimate Std. Error t value Pr(>|t|)
## (Intercept) -119.697 68.148 -1.756 0.096 .
## X 21.904 1.518 14.428 2.47e-11 ***
## ---
## Signif. codes: 0 '***' 0.001 '**' 0.01 '*' 0.05 '.' 0.1 ' ' 1
##
## Residual standard error: 79.1 on 18 degrees of freedom
## Multiple R-squared: 0.9204, Adjusted R-squared: 0.916
## F-statistic: 208.2 on 1 and 18 DF, p-value: 2.466e-11# 用這個線性回歸模型來對上面模型中的參數作出預測:
X_new <- data.frame(X=23:60)
conf_95 <- predict(res_lm, X_new, interval = "confidence", level = 0.95)
pred_95 <- predict(res_lm, X_new, interval = "prediction", level = 0.95)temp_var <- predict(res_lm, interval="prediction")## Warning in predict.lm(res_lm, interval = "prediction"): predictions on current data refer to _future_ responsesnew_df <- cbind(Salary, temp_var)
ggplot(new_df, aes(x = X, y = Y)) +
geom_point(shape = 1, size = 4) + theme(plot.subtitle = element_text(vjust = 1),
plot.caption = element_text(vjust = 1),
axis.line = element_line(colour = "bisque4",
size = 0.2, linetype = "solid"),
axis.ticks = element_line(size = 0.7),
axis.title = element_text(size = 16),
axis.text = element_text(size = 16, colour = "gray0"),
panel.background = element_rect(fill = "gray98")) +
geom_smooth(method = lm, se=TRUE, size = 0.3)+
scale_y_continuous(limits = c(200, 1400), breaks = c(200, 600, 1000, 1400)) +
geom_line(aes(y=lwr), color = "red", linetype = "dashed")+
geom_line(aes(y=upr), color = "red", linetype = "dashed")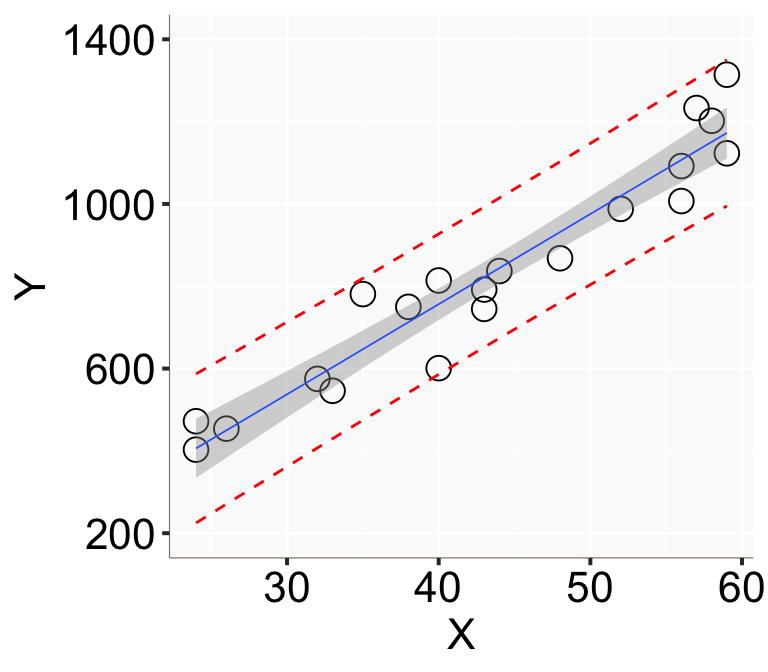
Figure 2: 用簡單線性回歸模型計算的基本年收的信賴區間(灰色陰影)和預測區間(紅色點線)。
Step 3, 寫下Stan模型
data {
    int N;
    real X[N];
    real Y[N];
}

parameters {
    real a;
    real b;
    real<lower=0> sigma;
}

model {
    for(n in 1:N) {
        Y[n] ~ normal(a + b*X[n], sigma);
    }
}
參數部分 real<lower=0> sigma 的代碼表示標準差不可採集負數作爲樣本。
實際運行上面的Stan代碼:
library(rstan)
data <- list(N=nrow(Salary), X=Salary$X, Y = Salary$Y)
fit <- sampling(model4_5, data, seed = 1234)
##
## SAMPLING FOR MODEL '5b73686886069c0bad70513d4ea4141a' NOW (CHAIN 1).
## Chain 1:
## Chain 1: Gradient evaluation took 1.5e-05 seconds
## Chain 1: 1000 transitions using 10 leapfrog steps per transition would take 0.15 seconds.
## Chain 1: Adjust your expectations accordingly!
## Chain 1:
## Chain 1:
## Chain 1: Iteration: 1 / 2000 [ 0%] (Warmup)
## Chain 1: Iteration: 200 / 2000 [ 10%] (Warmup)
## Chain 1: Iteration: 400 / 2000 [ 20%] (Warmup)
## Chain 1: Iteration: 600 / 2000 [ 30%] (Warmup)
## Chain 1: Iteration: 800 / 2000 [ 40%] (Warmup)
## Chain 1: Iteration: 1000 / 2000 [ 50%] (Warmup)
## Chain 1: Iteration: 1001 / 2000 [ 50%] (Sampling)
## Chain 1: Iteration: 1200 / 2000 [ 60%] (Sampling)
## Chain 1: Iteration: 1400 / 2000 [ 70%] (Sampling)
## Chain 1: Iteration: 1600 / 2000 [ 80%] (Sampling)
## Chain 1: Iteration: 1800 / 2000 [ 90%] (Sampling)
## Chain 1: Iteration: 2000 / 2000 [100%] (Sampling)
## Chain 1:
## Chain 1: Elapsed Time: 0.093322 seconds (Warm-up)
## Chain 1: 0.054914 seconds (Sampling)
## Chain 1: 0.148236 seconds (Total)
## Chain 1:
##
## SAMPLING FOR MODEL '5b73686886069c0bad70513d4ea4141a' NOW (CHAIN 2).
## Chain 2:
## Chain 2: Gradient evaluation took 4e-06 seconds
## Chain 2: 1000 transitions using 10 leapfrog steps per transition would take 0.04 seconds.
## Chain 2: Adjust your expectations accordingly!
## Chain 2:
## Chain 2:
## Chain 2: Iteration: 1 / 2000 [ 0%] (Warmup)
## Chain 2: Iteration: 200 / 2000 [ 10%] (Warmup)
## Chain 2: Iteration: 400 / 2000 [ 20%] (Warmup)
## Chain 2: Iteration: 600 / 2000 [ 30%] (Warmup)
## Chain 2: Iteration: 800 / 2000 [ 40%] (Warmup)
## Chain 2: Iteration: 1000 / 2000 [ 50%] (Warmup)
## Chain 2: Iteration: 1001 / 2000 [ 50%] (Sampling)
## Chain 2: Iteration: 1200 / 2000 [ 60%] (Sampling)
## Chain 2: Iteration: 1400 / 2000 [ 70%] (Sampling)
## Chain 2: Iteration: 1600 / 2000 [ 80%] (Sampling)
## Chain 2: Iteration: 1800 / 2000 [ 90%] (Sampling)
## Chain 2: Iteration: 2000 / 2000 [100%] (Sampling)
## Chain 2:
## Chain 2: Elapsed Time: 0.098838 seconds (Warm-up)
## Chain 2: 0.061329 seconds (Sampling)
## Chain 2: 0.160167 seconds (Total)
## Chain 2:
##
## SAMPLING FOR MODEL '5b73686886069c0bad70513d4ea4141a' NOW (CHAIN 3).
## Chain 3:
## Chain 3: Gradient evaluation took 4e-06 seconds
## Chain 3: 1000 transitions using 10 leapfrog steps per transition would take 0.04 seconds.
## Chain 3: Adjust your expectations accordingly!
## Chain 3:
## Chain 3:
## Chain 3: Iteration: 1 / 2000 [ 0%] (Warmup)
## Chain 3: Iteration: 200 / 2000 [ 10%] (Warmup)
## Chain 3: Iteration: 400 / 2000 [ 20%] (Warmup)
## Chain 3: Iteration: 600 / 2000 [ 30%] (Warmup)
## Chain 3: Iteration: 800 / 2000 [ 40%] (Warmup)
## Chain 3: Iteration: 1000 / 2000 [ 50%] (Warmup)
## Chain 3: Iteration: 1001 / 2000 [ 50%] (Sampling)
## Chain 3: Iteration: 1200 / 2000 [ 60%] (Sampling)
## Chain 3: Iteration: 1400 / 2000 [ 70%] (Sampling)
## Chain 3: Iteration: 1600 / 2000 [ 80%] (Sampling)
## Chain 3: Iteration: 1800 / 2000 [ 90%] (Sampling)
## Chain 3: Iteration: 2000 / 2000 [100%] (Sampling)
## Chain 3:
## Chain 3: Elapsed Time: 0.091017 seconds (Warm-up)
## Chain 3: 0.053765 seconds (Sampling)
## Chain 3: 0.144782 seconds (Total)
## Chain 3:
##
## SAMPLING FOR MODEL '5b73686886069c0bad70513d4ea4141a' NOW (CHAIN 4).
## Chain 4:
## Chain 4: Gradient evaluation took 4e-06 seconds
## Chain 4: 1000 transitions using 10 leapfrog steps per transition would take 0.04 seconds.
## Chain 4: Adjust your expectations accordingly!
## Chain 4:
## Chain 4:
## Chain 4: Iteration: 1 / 2000 [ 0%] (Warmup)
## Chain 4: Iteration: 200 / 2000 [ 10%] (Warmup)
## Chain 4: Iteration: 400 / 2000 [ 20%] (Warmup)
## Chain 4: Iteration: 600 / 2000 [ 30%] (Warmup)
## Chain 4: Iteration: 800 / 2000 [ 40%] (Warmup)
## Chain 4: Iteration: 1000 / 2000 [ 50%] (Warmup)
## Chain 4: Iteration: 1001 / 2000 [ 50%] (Sampling)
## Chain 4: Iteration: 1200 / 2000 [ 60%] (Sampling)
## Chain 4: Iteration: 1400 / 2000 [ 70%] (Sampling)
## Chain 4: Iteration: 1600 / 2000 [ 80%] (Sampling)
## Chain 4: Iteration: 1800 / 2000 [ 90%] (Sampling)
## Chain 4: Iteration: 2000 / 2000 [100%] (Sampling)
## Chain 4:
## Chain 4: Elapsed Time: 0.100685 seconds (Warm-up)
## Chain 4: 0.062005 seconds (Sampling)
## Chain 4: 0.16269 seconds (Total)
## Chain 4:print(fit)## Inference for Stan model: 5b73686886069c0bad70513d4ea4141a.
## 4 chains, each with iter=2000; warmup=1000; thin=1;
## post-warmup draws per chain=1000, total post-warmup draws=4000.
##
## mean se_mean sd 2.5% 25% 50% 75% 97.5% n_eff Rhat
## a -117.45 1.93 71.31 -257.66 -164.65 -119.17 -71.98 23.17 1358 1.00
## b 21.86 0.04 1.60 18.68 20.83 21.89 22.91 24.97 1331 1.00
## sigma 84.51 0.41 15.21 61.09 73.72 82.41 93.18 120.03 1381 1.01
## lp__ -93.61 0.04 1.26 -96.86 -94.19 -93.27 -92.69 -92.14 1164 1.01
##
## Samples were drawn using NUTS(diag_e) at Mon May 18 14:21:36 2020.
## For each parameter, n_eff is a crude measure of effective sample size,
## and Rhat is the potential scale reduction factor on split chains (at
## convergence, Rhat=1).輸出結果的前三行,是該次MCMC的設定條件,其中模型名稱是Rmarkdown文件中隨機產生的。
第二行則說明的是該次MCMC進行了4條鏈的採樣,每條鏈2000次,其中前1000次被當作是 burn-in (或者叫 warmup)。可以看到一共獲得了4000個事後樣本。
接下來的五行是參數的事後樣本的事後分析總結,一共有11列。
- 第1列是參數名稱,最後一個
lp__是Stan特有的算法得到的產物,具體解釋爲對數事後概率 (log posterior),當然它也需要得到收斂才行。 - 第2列是獲得的4000個參數的事後樣本的事後平均值(posterior mean)。例如
b(回歸直線的斜率)的事後平均值是21.96,也就是說年齡每增加一歲,基本年收入平均增加21.96萬日元。你可以和之前的概率論算法相比較(b = 21.904)。 - 第3列
se_mean是事後平均值的標準誤(standard error of posterior mean)。說白了是MCMC事後樣本的方差除以第10列的有效樣本量n_eff之後取根號獲得的值。 - 第4列
sd是MCMC事後樣本的標準差(standard deviation of posterior MCMC sample)。 - 第5-9列是MCMC事後樣本的四分位點。也就是貝葉斯統計算法獲得的事後可信區間。
- 第10列
n_eff是Stan在基於事後樣本自相關程度來判斷的有效事後樣本量大小。爲了有效地計算和繪製事後分佈的統計量,這個有效樣本量需要至少有100個以上吧(作者觀點)。如果報告給出的事後有效樣本量過小的話也是模型收斂不佳的表現之一。 - 第11列
Rhat\((\hat R)\)是主要用於判斷模型是否達到收斂的重要指標,每個參數都會被計算一個Rhat值。當MCMC鏈條數在3以上,且同時所有的模型參數的Rhat < 1.1的話,可以認爲模型達到了良好的收斂。
- 第1列是參數名稱,最後一個
Step 4, 診斷Stan貝葉斯模型的收斂程度
library(ggmcmc)

ggmcmc(ggs(fit, inc_warmup = TRUE, stan_include_auxiliar = TRUE), plot = "traceplot", dev_type_html = "png",
       file = "trace.html")
上面的代碼,會自動生成四個模型參數的軌跡MCMC鏈式圖報告。

Figure 3: 用ggmcmc函數製作而成的MCMC鏈式圖報告。
library(bayesplot)

color_scheme_set("mix-brightblue-gray")

posterior2 <- rstan::extract(fit, inc_warmup = TRUE, permuted = FALSE)

p <- mcmc_trace(posterior2, n_warmup = 0,
                facet_args = list(nrow = 2, labeller = label_parsed))
p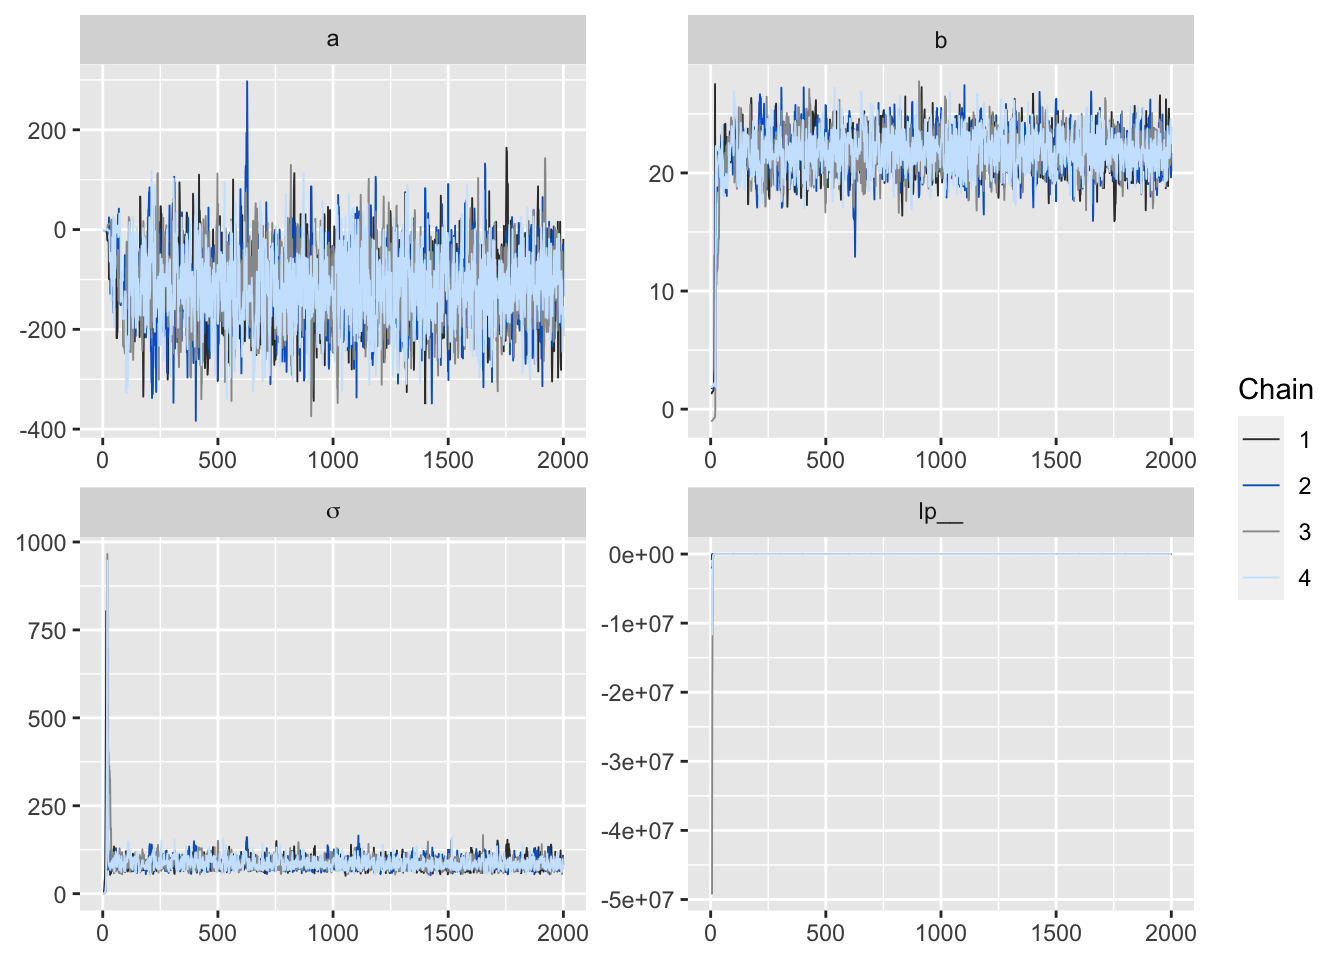
Figure 4: 用 bayesplot包數繪製的MCMC鏈式圖。
p <- mcmc_acf_bar(posterior2)
p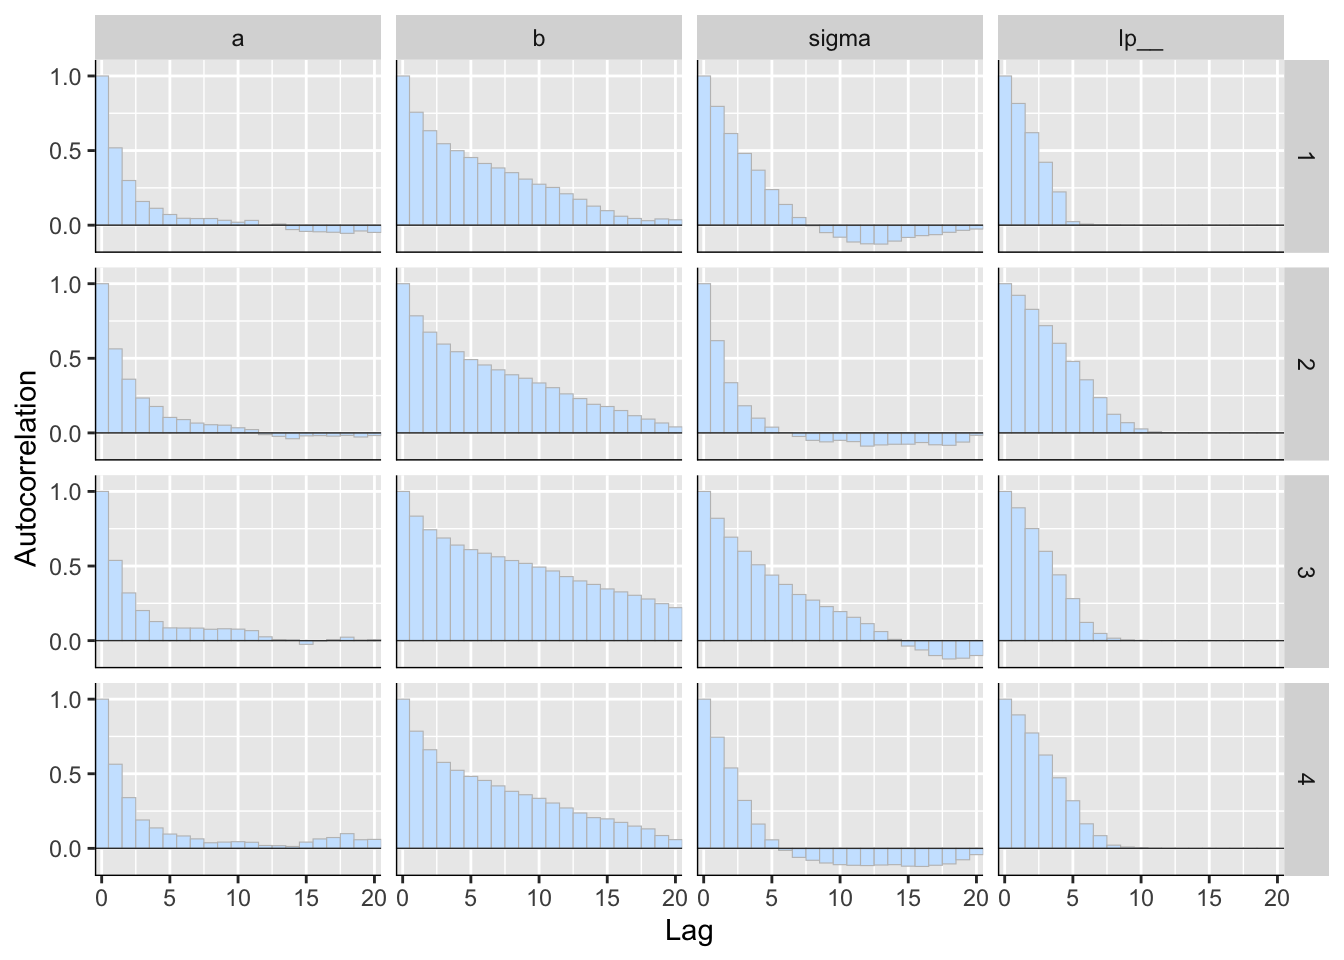
Figure 5: 用 bayesplot包數繪製的事後樣本自相關圖(autocorrelation)。
p <- mcmc_dens_overlay(posterior2, color_chains = T)
p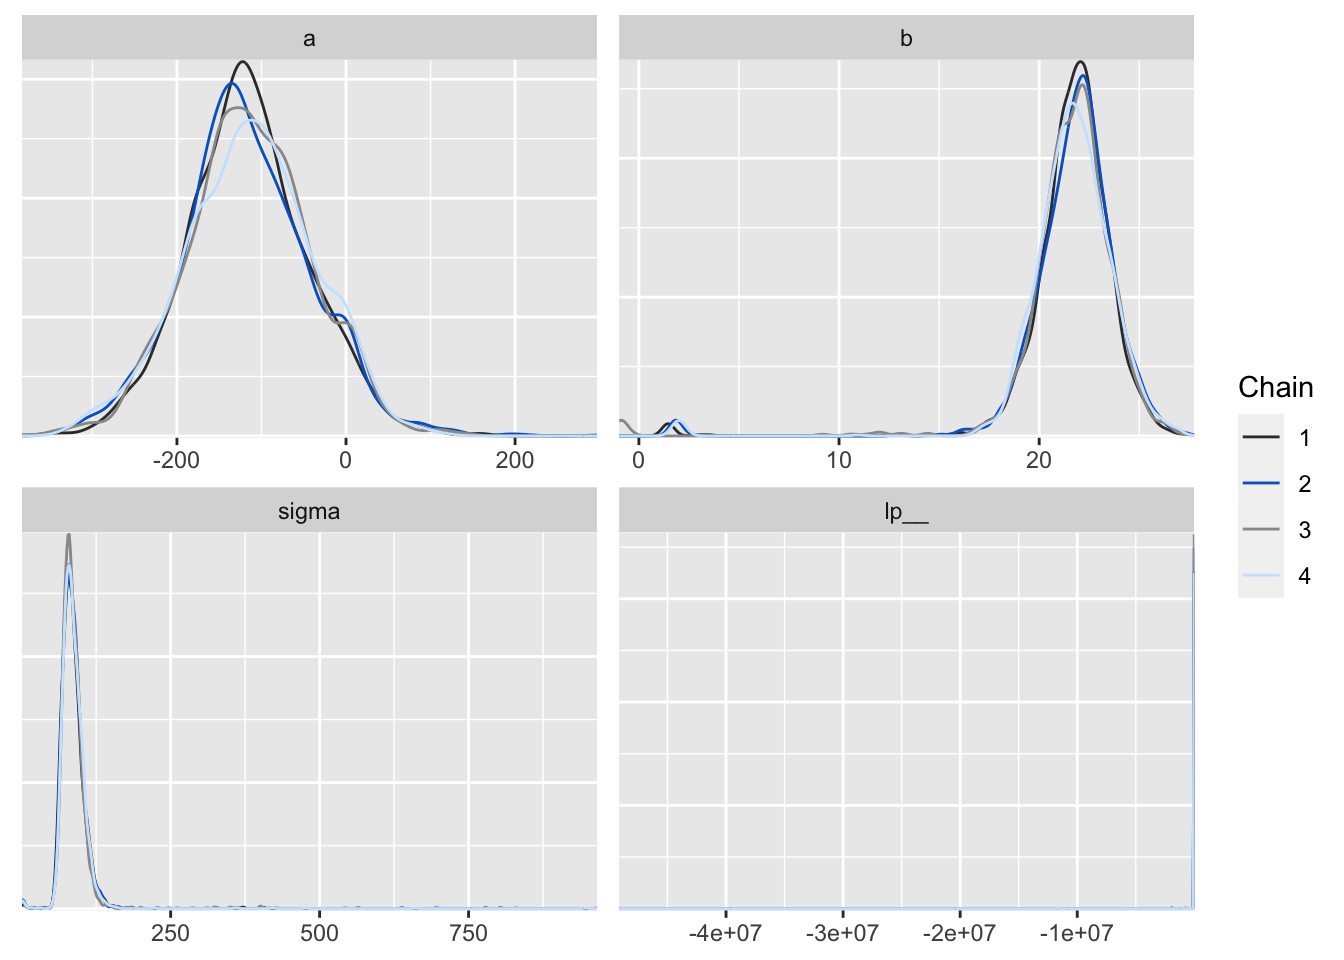
Figure 6: 用 bayesplot包數繪製的事後樣本密度分佈圖。
Step 5,修改MCMC條件設定
進行貝葉斯模型擬合的過程中,常常需要不停地修改模型的條件,例如縮短warm-up等。下面的Rstan代碼可以實現簡便地頻繁修改MCMC條件設定:
# library(rstan) uncomment if run for the first time
data <- list(N=nrow(Salary), X=Salary$X, Y = Salary$Y)
fit2 <- sampling(
    model4_5,
    data = data,
    pars = c("b", "sigma"),
    init = function(){
      list(a = runif(1, -10, 10), b = runif(1, 0, 10), sigma = 10)
    },
    seed = 123,
    chains = 3, iter = 1000, warmup = 200, thin = 2
)
##
## SAMPLING FOR MODEL '5b73686886069c0bad70513d4ea4141a' NOW (CHAIN 1).
## Chain 1:
## Chain 1: Gradient evaluation took 1.2e-05 seconds
## Chain 1: 1000 transitions using 10 leapfrog steps per transition would take 0.12 seconds.
## Chain 1: Adjust your expectations accordingly!
## Chain 1:
## Chain 1:
## Chain 1: Iteration: 1 / 1000 [ 0%] (Warmup)
## Chain 1: Iteration: 100 / 1000 [ 10%] (Warmup)
## Chain 1: Iteration: 200 / 1000 [ 20%] (Warmup)
## Chain 1: Iteration: 201 / 1000 [ 20%] (Sampling)
## Chain 1: Iteration: 300 / 1000 [ 30%] (Sampling)
## Chain 1: Iteration: 400 / 1000 [ 40%] (Sampling)
## Chain 1: Iteration: 500 / 1000 [ 50%] (Sampling)
## Chain 1: Iteration: 600 / 1000 [ 60%] (Sampling)
## Chain 1: Iteration: 700 / 1000 [ 70%] (Sampling)
## Chain 1: Iteration: 800 / 1000 [ 80%] (Sampling)
## Chain 1: Iteration: 900 / 1000 [ 90%] (Sampling)
## Chain 1: Iteration: 1000 / 1000 [100%] (Sampling)
## Chain 1:
## Chain 1: Elapsed Time: 0.05316 seconds (Warm-up)
## Chain 1: 0.036218 seconds (Sampling)
## Chain 1: 0.089378 seconds (Total)
## Chain 1:
##
## SAMPLING FOR MODEL '5b73686886069c0bad70513d4ea4141a' NOW (CHAIN 2).
## Chain 2:
## Chain 2: Gradient evaluation took 2e-06 seconds
## Chain 2: 1000 transitions using 10 leapfrog steps per transition would take 0.02 seconds.
## Chain 2: Adjust your expectations accordingly!
## Chain 2:
## Chain 2:
## Chain 2: Iteration: 1 / 1000 [ 0%] (Warmup)
## Chain 2: Iteration: 100 / 1000 [ 10%] (Warmup)
## Chain 2: Iteration: 200 / 1000 [ 20%] (Warmup)
## Chain 2: Iteration: 201 / 1000 [ 20%] (Sampling)
## Chain 2: Iteration: 300 / 1000 [ 30%] (Sampling)
## Chain 2: Iteration: 400 / 1000 [ 40%] (Sampling)
## Chain 2: Iteration: 500 / 1000 [ 50%] (Sampling)
## Chain 2: Iteration: 600 / 1000 [ 60%] (Sampling)
## Chain 2: Iteration: 700 / 1000 [ 70%] (Sampling)
## Chain 2: Iteration: 800 / 1000 [ 80%] (Sampling)
## Chain 2: Iteration: 900 / 1000 [ 90%] (Sampling)
## Chain 2: Iteration: 1000 / 1000 [100%] (Sampling)
## Chain 2:
## Chain 2: Elapsed Time: 0.052191 seconds (Warm-up)
## Chain 2: 0.036956 seconds (Sampling)
## Chain 2: 0.089147 seconds (Total)
## Chain 2:
##
## SAMPLING FOR MODEL '5b73686886069c0bad70513d4ea4141a' NOW (CHAIN 3).
## Chain 3:
## Chain 3: Gradient evaluation took 2e-06 seconds
## Chain 3: 1000 transitions using 10 leapfrog steps per transition would take 0.02 seconds.
## Chain 3: Adjust your expectations accordingly!
## Chain 3:
## Chain 3:
## Chain 3: Iteration: 1 / 1000 [ 0%] (Warmup)
## Chain 3: Iteration: 100 / 1000 [ 10%] (Warmup)
## Chain 3: Iteration: 200 / 1000 [ 20%] (Warmup)
## Chain 3: Iteration: 201 / 1000 [ 20%] (Sampling)
## Chain 3: Iteration: 300 / 1000 [ 30%] (Sampling)
## Chain 3: Iteration: 400 / 1000 [ 40%] (Sampling)
## Chain 3: Iteration: 500 / 1000 [ 50%] (Sampling)
## Chain 3: Iteration: 600 / 1000 [ 60%] (Sampling)
## Chain 3: Iteration: 700 / 1000 [ 70%] (Sampling)
## Chain 3: Iteration: 800 / 1000 [ 80%] (Sampling)
## Chain 3: Iteration: 900 / 1000 [ 90%] (Sampling)
## Chain 3: Iteration: 1000 / 1000 [100%] (Sampling)
## Chain 3:
## Chain 3: Elapsed Time: 0.052083 seconds (Warm-up)
## Chain 3: 0.042977 seconds (Sampling)
## Chain 3: 0.09506 seconds (Total)
## Chain 3:print(fit2)## Inference for Stan model: 5b73686886069c0bad70513d4ea4141a.
## 3 chains, each with iter=1000; warmup=200; thin=2;
## post-warmup draws per chain=400, total post-warmup draws=1200.
##
## mean se_mean sd 2.5% 25% 50% 75% 97.5% n_eff Rhat
## b 21.90 0.06 1.56 18.56 20.96 21.92 22.91 24.83 587 1.00
## sigma 85.49 0.58 15.60 61.11 74.29 83.15 94.85 122.67 727 1.01
## lp__ -93.62 0.05 1.29 -96.82 -94.22 -93.30 -92.70 -92.16 609 1.00
##
## Samples were drawn using NUTS(diag_e) at Mon May 18 14:27:30 2020.
## For each parameter, n_eff is a crude measure of effective sample size,
## and Rhat is the potential scale reduction factor on split chains (at
## convergence, Rhat=1).其中fit的最後一行是修改各種條件的示例:
chains至少要三條;iter一開始可以設定在500~1000左右,確定模型可以收斂以後,再加大這個數值以獲得穩定的事後統計量,多多益善;warmup,也就MCMC採樣開始後多少樣本可以丟棄。這個數值需要參考trace plot;thin,通常只需要保持默認值 1。和WinBUGS, JAGS相比Stan算法採集的事後樣本自相關比較低。
Step 6, 並行(平行)計算的設定
如果你寫出來的貝葉斯模型需要很長時間的計算和收斂,可以充分利用你的計算機的多核計算,把每條MCMC鏈單獨進行計算加速這個過程:
parallel::detectCores() #我的桌上型電腦有8個核可以用於平行計算## [1] 8但是平行計算時如果計算中出錯則由於每條鏈都是相互獨立地進行,報錯就減少了。所以如果要使用多核同時計算的話,建議先減少採樣數,確認不會報錯以後再用多核平行計算增加採樣量。
rstan_options(auto_write = TRUE)
options(mc.cores = parallel::detectCores())
Step 7, 計算貝葉斯可信區間和貝葉斯預測區間
這一步就又回到一開始提出的研究問題上來,我們來計算基本年收的貝葉斯可信區間和貝葉斯預測區間。
ms <- rstan::extract(fit)

quantile(ms$b, probs = c(0.025, 0.975))
## 2.5% 97.5%
## 18.67987 24.97108d_mcmc <- data.frame(a = ms$a, b = ms$b, sigma = ms$sigma)
head(d_mcmc)## a b sigma
## 1 -103.92295 22.04743 70.39829
## 2 -30.41656 20.16582 74.35210
## 3 -95.35165 21.32534 75.19714
## 4 -10.88849 19.01547 68.02757
## 5 -177.04183 23.49984 81.40161
## 6 -146.45260 22.73838 95.97706p1 <- ggplot(d_mcmc, aes(x = a, y = b)) +
geom_point(shape = 1, size = 4)
ggExtra::ggMarginal(
p = p1,
type = 'density',
margins = 'both',
size = 4,
colour = 'black',
fill = '#2D077A'
)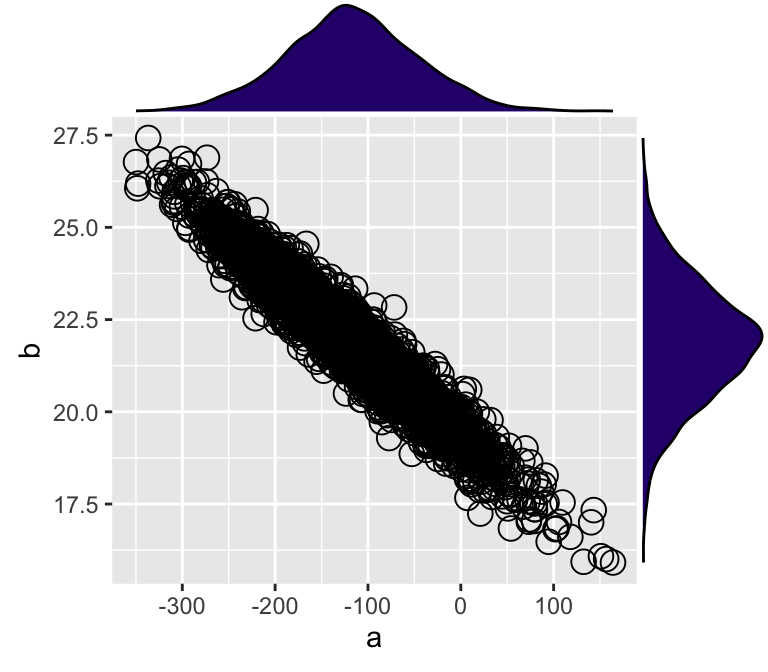
Figure 7: MCMC樣本的兩個模型參數的事後散點圖,及它們之間的邊緣分佈密度圖。
從圖7中可觀察到該貝葉斯線性模型獲得的事後模型參數樣本中,截距a,和斜率b之間呈極強的負相關關係。也就是說,截距是工資的起點(年齡爲0歲時),這個起點的理論值越低,斜率越大(歲年齡增加工資上升的速度越大)。
根據上面分析的結果,下面的R代碼可以計算一名50歲的人被這家公司採用的時候,她/他的預期基本年收入的分佈(中獲得的MCMC樣本),和她/他的預期總年收的預測分佈(中獲得的MCMC樣本)。
N_mcmc <- length(ms$lp__)
y50_base <- ms$a + ms$b*50
y50 <- rnorm(n = N_mcmc, mean = y50_base, sd = ms$sigma)
d_mcmc <- data.frame(a = ms$a, b = ms$b, sigma = ms$sigma, y50_base, y50)
head(d_mcmc)
## a b sigma y50_base y50
## 1 -103.92295 22.04743 70.39829 998.4488 953.4024
## 2 -30.41656 20.16582 74.35210 977.8746 861.2176
## 3 -95.35165 21.32534 75.19714 970.9152 1076.7587
## 4 -10.88849 19.01547 68.02757 939.8852 877.2139
## 5 -177.04183 23.49984 81.40161 997.9499 1109.8183
## 6 -146.45260 22.73838 95.97706 990.4664 1063.0656# the following codes are also available from the author's page:
# https://github.com/MatsuuraKentaro/RStanBook/blob/master/chap04/fig4-8.R
# library(ggplot2)
source('commonRstan.R')
# load('output/result-model4-5.RData')
ms <- rstan::extract(fit)
X_new <- 23:60
N_X <- length(X_new)
N_mcmc <- length(ms$lp__)
set.seed(1234)
y_base_mcmc <- as.data.frame(matrix(nrow=N_mcmc, ncol=N_X))
y_mcmc <- as.data.frame(matrix(nrow=N_mcmc, ncol=N_X))
for (i in 1:N_X) {
y_base_mcmc[,i] <- ms$a + ms$b * X_new[i]
y_mcmc[,i] <- rnorm(n=N_mcmc, mean=y_base_mcmc[,i], sd=ms$sigma)
}
customize.ggplot.axis <- function(p) {
p <- p + labs(x='X', y='Y')
p <- p + scale_y_continuous(breaks=seq(from=200, to=1400, by=400))
p <- p + coord_cartesian(xlim=c(22, 61), ylim=c(200, 1400))
return(p)
}
d_est <- data.frame.quantile.mcmc(x=X_new, y_mcmc=y_base_mcmc)
p <- ggplot.5quantile(data=d_est)
p <- p + geom_point(data=Salary, aes(x=X, y=Y), shape=1, size=3)
p <- customize.ggplot.axis(p)
# ggsave(file='output/fig4-8-left.png', plot=p, dpi=300, w=4, h=3)
p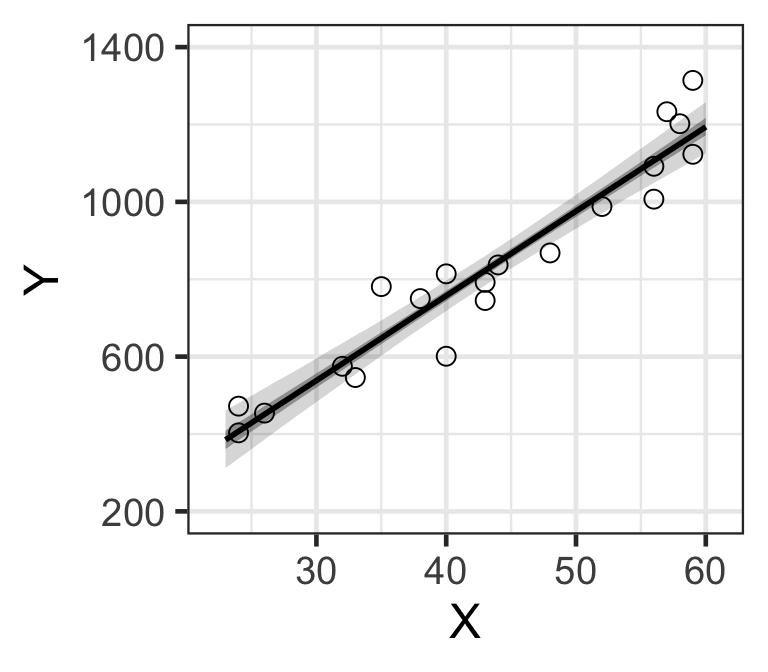
Figure 8: MCMC樣本計算獲得的基本年收的貝葉斯可信區間。
d_est <- data.frame.quantile.mcmc(x=X_new, y_mcmc=y_mcmc)
p <- ggplot.5quantile(data=d_est)
p <- p + geom_point(data=Salary, aes(x=X, y=Y), shape=1, size=3)
p <- customize.ggplot.axis(p)
p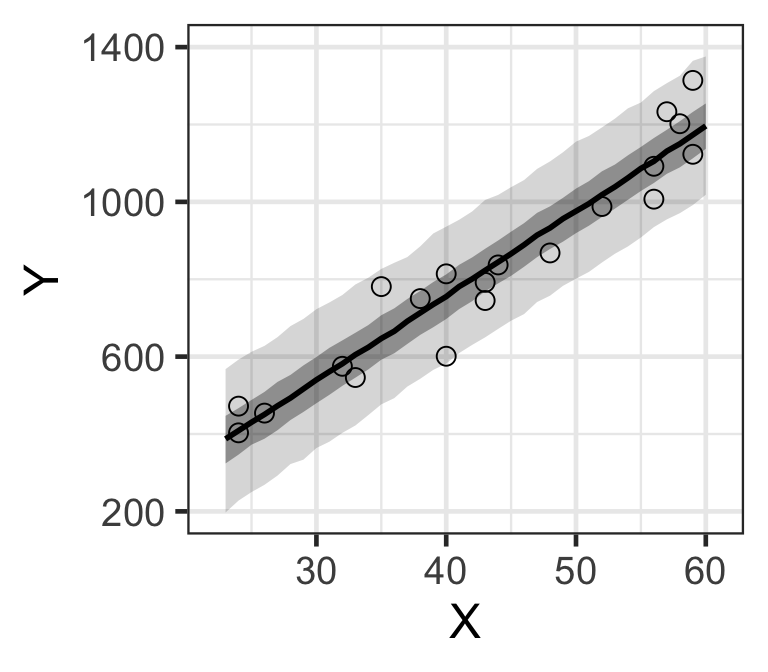
Figure 9: MCMC樣本計算獲得的預期總年收的貝葉斯預測區間。(顏色較深的是50%預測區間帶,黑線是事後樣本的中央值)
# ggsave(file='output/fig4-8-right.png', plot=p, dpi=300, w=4, h=3)練習題
用模擬數據來嘗試進行貝葉斯t檢驗
set.seed(123)
N1 <- 30
N2 <- 20
Y1 <- rnorm(n=N1, mean=0, sd=5)
Y2 <- rnorm(n=N2, mean=1, sd=4)- 請繪製上面代碼生成的兩組數據的示意圖
d1 <- data.frame(group=1, Y=Y1)
d2 <- data.frame(group=2, Y=Y2)
d <- rbind(d1, d2)
d$group <- as.factor(d$group)

p <- ggplot(data=d, aes(x=group, y=Y, group=group, col=group))
p <- p + geom_boxplot(outlier.size=0)
p <- p + geom_point(position=position_jitter(w=0.4, h=0), size=2)
p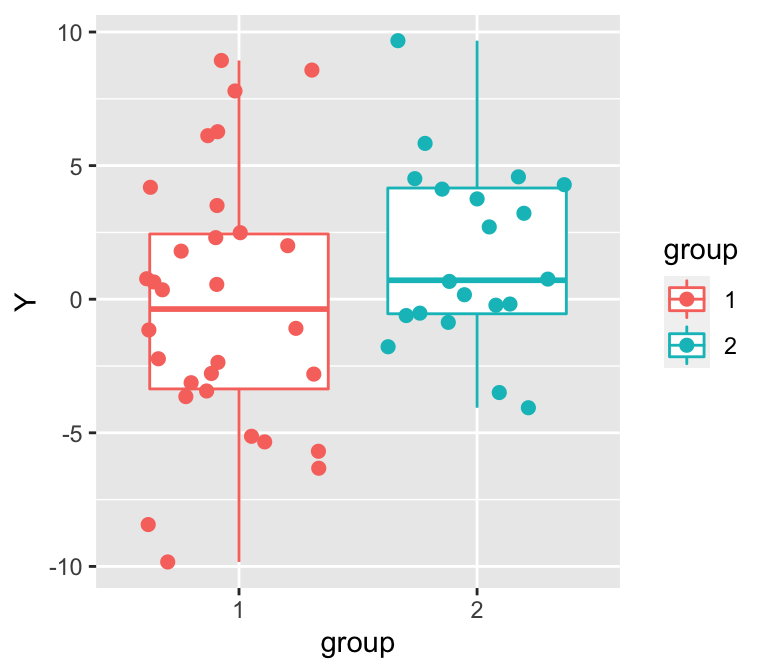
Figure 10: 隨機生成的兩組數據的散點圖和箱式圖。
#ggsave(file='fig-ex1.png', plot=p, dpi=300, w=4, h=3)- 寫下相當於t檢驗的數學式,表示各組之間方差或者標準差如果相等時,均值比較的檢驗模型。
hypotheses:
- observations in each group follow a normal distribution
- all observations are independent
- The two population variance/standard deviations are known (and can be considered equal)
\[ \text{H}_0: \mu_2 - \mu_1 = 0 \\ \text{H}_1: \mu_2 - \mu_1 \neq 0 \\ \text{If H}_0 \text{ is true, then:} \\ Z=\frac{\bar{Y_2} - \bar{Y_1}}{\sqrt{(\sigma_2^2/n_2) + (\sigma_1^2/n_1)}} \\ \text{follows a standard normal distribution with zero mean} \\ \Rightarrow \text{ if two variances are considered the same}\\ Y_1[n] \sim N(\mu_1, \sigma) \;\; n = 1,2,\dots,N \\ Y_2[n] \sim N(\mu_2, \sigma) \;\; n = 1,2,\dots,N \]
- 寫下上一步模型的Stan代碼,並嘗試在R裏運行
Stan代碼如下:
data {
  int N1;
  int N2;
  real Y1[N1];
  real Y2[N2];
}

parameters {
  real mu1;
  real mu2;
  real<lower=0> sigma;
}

model {
  for (n in 1:N1)
    Y1[n] ~ normal(mu1, sigma);
  for (n in 1:N2)
    Y2[n] ~ normal(mu2, sigma);
}
R代碼如下:
library(rstan)## Loading required package: StanHeaders## Loading required package: ggplot2## rstan (Version 2.19.3, GitRev: 2e1f913d3ca3)## For execution on a local, multicore CPU with excess RAM we recommend calling
## options(mc.cores = parallel::detectCores()).
## To avoid recompilation of unchanged Stan programs, we recommend calling
## rstan_options(auto_write = TRUE)data <- list(N1=N1, N2=N2, Y1=Y1, Y2=Y2)
exe13 <- stan_model(file = "stanfiles/ex3.stan")
fit <- sampling(exe13, data=data, seed=1234)##
## SAMPLING FOR MODEL 'ex3' NOW (CHAIN 1).
## Chain 1:
## Chain 1: Gradient evaluation took 1.5e-05 seconds
## Chain 1: 1000 transitions using 10 leapfrog steps per transition would take 0.15 seconds.
## Chain 1: Adjust your expectations accordingly!
## Chain 1:
## Chain 1:
## Chain 1: Iteration: 1 / 2000 [ 0%] (Warmup)
## Chain 1: Iteration: 200 / 2000 [ 10%] (Warmup)
## Chain 1: Iteration: 400 / 2000 [ 20%] (Warmup)
## Chain 1: Iteration: 600 / 2000 [ 30%] (Warmup)
## Chain 1: Iteration: 800 / 2000 [ 40%] (Warmup)
## Chain 1: Iteration: 1000 / 2000 [ 50%] (Warmup)
## Chain 1: Iteration: 1001 / 2000 [ 50%] (Sampling)
## Chain 1: Iteration: 1200 / 2000 [ 60%] (Sampling)
## Chain 1: Iteration: 1400 / 2000 [ 70%] (Sampling)
## Chain 1: Iteration: 1600 / 2000 [ 80%] (Sampling)
## Chain 1: Iteration: 1800 / 2000 [ 90%] (Sampling)
## Chain 1: Iteration: 2000 / 2000 [100%] (Sampling)
## Chain 1:
## Chain 1: Elapsed Time: 0.027413 seconds (Warm-up)
## Chain 1: 0.022648 seconds (Sampling)
## Chain 1: 0.050061 seconds (Total)
## Chain 1:
##
## SAMPLING FOR MODEL 'ex3' NOW (CHAIN 2).
## Chain 2:
## Chain 2: Gradient evaluation took 4e-06 seconds
## Chain 2: 1000 transitions using 10 leapfrog steps per transition would take 0.04 seconds.
## Chain 2: Adjust your expectations accordingly!
## Chain 2:
## Chain 2:
## Chain 2: Iteration: 1 / 2000 [ 0%] (Warmup)
## Chain 2: Iteration: 200 / 2000 [ 10%] (Warmup)
## Chain 2: Iteration: 400 / 2000 [ 20%] (Warmup)
## Chain 2: Iteration: 600 / 2000 [ 30%] (Warmup)
## Chain 2: Iteration: 800 / 2000 [ 40%] (Warmup)
## Chain 2: Iteration: 1000 / 2000 [ 50%] (Warmup)
## Chain 2: Iteration: 1001 / 2000 [ 50%] (Sampling)
## Chain 2: Iteration: 1200 / 2000 [ 60%] (Sampling)
## Chain 2: Iteration: 1400 / 2000 [ 70%] (Sampling)
## Chain 2: Iteration: 1600 / 2000 [ 80%] (Sampling)
## Chain 2: Iteration: 1800 / 2000 [ 90%] (Sampling)
## Chain 2: Iteration: 2000 / 2000 [100%] (Sampling)
## Chain 2:
## Chain 2: Elapsed Time: 0.028538 seconds (Warm-up)
## Chain 2: 0.021555 seconds (Sampling)
## Chain 2: 0.050093 seconds (Total)
## Chain 2:
##
## SAMPLING FOR MODEL 'ex3' NOW (CHAIN 3).
## Chain 3:
## Chain 3: Gradient evaluation took 5e-06 seconds
## Chain 3: 1000 transitions using 10 leapfrog steps per transition would take 0.05 seconds.
## Chain 3: Adjust your expectations accordingly!
## Chain 3:
## Chain 3:
## Chain 3: Iteration: 1 / 2000 [ 0%] (Warmup)
## Chain 3: Iteration: 200 / 2000 [ 10%] (Warmup)
## Chain 3: Iteration: 400 / 2000 [ 20%] (Warmup)
## Chain 3: Iteration: 600 / 2000 [ 30%] (Warmup)
## Chain 3: Iteration: 800 / 2000 [ 40%] (Warmup)
## Chain 3: Iteration: 1000 / 2000 [ 50%] (Warmup)
## Chain 3: Iteration: 1001 / 2000 [ 50%] (Sampling)
## Chain 3: Iteration: 1200 / 2000 [ 60%] (Sampling)
## Chain 3: Iteration: 1400 / 2000 [ 70%] (Sampling)
## Chain 3: Iteration: 1600 / 2000 [ 80%] (Sampling)
## Chain 3: Iteration: 1800 / 2000 [ 90%] (Sampling)
## Chain 3: Iteration: 2000 / 2000 [100%] (Sampling)
## Chain 3:
## Chain 3: Elapsed Time: 0.026656 seconds (Warm-up)
## Chain 3: 0.021916 seconds (Sampling)
## Chain 3: 0.048572 seconds (Total)
## Chain 3:
##
## SAMPLING FOR MODEL 'ex3' NOW (CHAIN 4).
## Chain 4:
## Chain 4: Gradient evaluation took 3e-06 seconds
## Chain 4: 1000 transitions using 10 leapfrog steps per transition would take 0.03 seconds.
## Chain 4: Adjust your expectations accordingly!
## Chain 4:
## Chain 4:
## Chain 4: Iteration: 1 / 2000 [ 0%] (Warmup)
## Chain 4: Iteration: 200 / 2000 [ 10%] (Warmup)
## Chain 4: Iteration: 400 / 2000 [ 20%] (Warmup)
## Chain 4: Iteration: 600 / 2000 [ 30%] (Warmup)
## Chain 4: Iteration: 800 / 2000 [ 40%] (Warmup)
## Chain 4: Iteration: 1000 / 2000 [ 50%] (Warmup)
## Chain 4: Iteration: 1001 / 2000 [ 50%] (Sampling)
## Chain 4: Iteration: 1200 / 2000 [ 60%] (Sampling)
## Chain 4: Iteration: 1400 / 2000 [ 70%] (Sampling)
## Chain 4: Iteration: 1600 / 2000 [ 80%] (Sampling)
## Chain 4: Iteration: 1800 / 2000 [ 90%] (Sampling)
## Chain 4: Iteration: 2000 / 2000 [100%] (Sampling)
## Chain 4:
## Chain 4: Elapsed Time: 0.027425 seconds (Warm-up)
## Chain 4: 0.020884 seconds (Sampling)
## Chain 4: 0.048309 seconds (Total)
## Chain 4:fit## Inference for Stan model: ex3.
## 4 chains, each with iter=2000; warmup=1000; thin=1;
## post-warmup draws per chain=1000, total post-warmup draws=4000.
##
## mean se_mean sd 2.5% 25% 50% 75% 97.5% n_eff Rhat
## mu1 -0.24 0.01 0.84 -1.93 -0.80 -0.23 0.30 1.40 3805 1
## mu2 1.59 0.02 0.99 -0.32 0.92 1.61 2.25 3.50 3739 1
## sigma 4.46 0.01 0.46 3.66 4.14 4.42 4.76 5.45 3402 1
## lp__ -97.74 0.03 1.23 -100.89 -98.32 -97.42 -96.84 -96.33 1879 1
##
## Samples were drawn using NUTS(diag_e) at Mon May 18 16:51:40 2020.
## For each parameter, n_eff is a crude measure of effective sample size,
## and Rhat is the potential scale reduction factor on split chains (at
## convergence, Rhat=1).- 從獲取到的事後參數的MCMC樣本計算 \(\text{Prob}[\mu_1 < \mu_2]\):
ms <- extract(fit)
prob <- mean(ms$mu1 < ms$mu2)  #=> 0.932
prob
## [1] 0.9235所以可以認爲地一組均值,小於第二組均值的事後概率是93.2%
- 如果不能認爲兩組的方差相等的話,模型又該改成什麼樣子?
\[ Y_1[n] \sim N(\mu_1, \sigma_1) \;\; n = 1,2,\dots,N \\ Y_2[n] \sim N(\mu_2, \sigma_2) \;\; n = 1,2,\dots,N \]
data {
  int N1;
  int N2;
  real Y1[N1];
  real Y2[N2];
}

parameters {
  real mu1;
  real mu2;
  real<lower=0> sigma1;
  real<lower=0> sigma2;
}

model {
  for (n in 1:N1)
    Y1[n] ~ normal(mu1, sigma1);
  for (n in 1:N2)
    Y2[n] ~ normal(mu2, sigma2);
}
下面的代碼相當於實施Welch的t檢驗:
library(rstan)
data <- list(N1=N1, N2=N2, Y1=Y1, Y2=Y2)
exe15 <- stan_model(file = "stanfiles/ex5.stan")

fit <- sampling(exe15, data=data, seed=1234)
##
## SAMPLING FOR MODEL 'ex5' NOW (CHAIN 1).
## Chain 1:
## Chain 1: Gradient evaluation took 1.2e-05 seconds
## Chain 1: 1000 transitions using 10 leapfrog steps per transition would take 0.12 seconds.
## Chain 1: Adjust your expectations accordingly!
## Chain 1:
## Chain 1:
## Chain 1: Iteration: 1 / 2000 [ 0%] (Warmup)
## Chain 1: Iteration: 200 / 2000 [ 10%] (Warmup)
## Chain 1: Iteration: 400 / 2000 [ 20%] (Warmup)
## Chain 1: Iteration: 600 / 2000 [ 30%] (Warmup)
## Chain 1: Iteration: 800 / 2000 [ 40%] (Warmup)
## Chain 1: Iteration: 1000 / 2000 [ 50%] (Warmup)
## Chain 1: Iteration: 1001 / 2000 [ 50%] (Sampling)
## Chain 1: Iteration: 1200 / 2000 [ 60%] (Sampling)
## Chain 1: Iteration: 1400 / 2000 [ 70%] (Sampling)
## Chain 1: Iteration: 1600 / 2000 [ 80%] (Sampling)
## Chain 1: Iteration: 1800 / 2000 [ 90%] (Sampling)
## Chain 1: Iteration: 2000 / 2000 [100%] (Sampling)
## Chain 1:
## Chain 1: Elapsed Time: 0.03039 seconds (Warm-up)
## Chain 1: 0.023831 seconds (Sampling)
## Chain 1: 0.054221 seconds (Total)
## Chain 1:
##
## SAMPLING FOR MODEL 'ex5' NOW (CHAIN 2).
## Chain 2:
## Chain 2: Gradient evaluation took 4e-06 seconds
## Chain 2: 1000 transitions using 10 leapfrog steps per transition would take 0.04 seconds.
## Chain 2: Adjust your expectations accordingly!
## Chain 2:
## Chain 2:
## Chain 2: Iteration: 1 / 2000 [ 0%] (Warmup)
## Chain 2: Iteration: 200 / 2000 [ 10%] (Warmup)
## Chain 2: Iteration: 400 / 2000 [ 20%] (Warmup)
## Chain 2: Iteration: 600 / 2000 [ 30%] (Warmup)
## Chain 2: Iteration: 800 / 2000 [ 40%] (Warmup)
## Chain 2: Iteration: 1000 / 2000 [ 50%] (Warmup)
## Chain 2: Iteration: 1001 / 2000 [ 50%] (Sampling)
## Chain 2: Iteration: 1200 / 2000 [ 60%] (Sampling)
## Chain 2: Iteration: 1400 / 2000 [ 70%] (Sampling)
## Chain 2: Iteration: 1600 / 2000 [ 80%] (Sampling)
## Chain 2: Iteration: 1800 / 2000 [ 90%] (Sampling)
## Chain 2: Iteration: 2000 / 2000 [100%] (Sampling)
## Chain 2:
## Chain 2: Elapsed Time: 0.028121 seconds (Warm-up)
## Chain 2: 0.026473 seconds (Sampling)
## Chain 2: 0.054594 seconds (Total)
## Chain 2:
##
## SAMPLING FOR MODEL 'ex5' NOW (CHAIN 3).
## Chain 3:
## Chain 3: Gradient evaluation took 1.6e-05 seconds
## Chain 3: 1000 transitions using 10 leapfrog steps per transition would take 0.16 seconds.
## Chain 3: Adjust your expectations accordingly!
## Chain 3:
## Chain 3:
## Chain 3: Iteration: 1 / 2000 [ 0%] (Warmup)
## Chain 3: Iteration: 200 / 2000 [ 10%] (Warmup)
## Chain 3: Iteration: 400 / 2000 [ 20%] (Warmup)
## Chain 3: Iteration: 600 / 2000 [ 30%] (Warmup)
## Chain 3: Iteration: 800 / 2000 [ 40%] (Warmup)
## Chain 3: Iteration: 1000 / 2000 [ 50%] (Warmup)
## Chain 3: Iteration: 1001 / 2000 [ 50%] (Sampling)
## Chain 3: Iteration: 1200 / 2000 [ 60%] (Sampling)
## Chain 3: Iteration: 1400 / 2000 [ 70%] (Sampling)
## Chain 3: Iteration: 1600 / 2000 [ 80%] (Sampling)
## Chain 3: Iteration: 1800 / 2000 [ 90%] (Sampling)
## Chain 3: Iteration: 2000 / 2000 [100%] (Sampling)
## Chain 3:
## Chain 3: Elapsed Time: 0.030293 seconds (Warm-up)
## Chain 3: 0.027682 seconds (Sampling)
## Chain 3: 0.057975 seconds (Total)
## Chain 3:
##
## SAMPLING FOR MODEL 'ex5' NOW (CHAIN 4).
## Chain 4:
## Chain 4: Gradient evaluation took 3e-06 seconds
## Chain 4: 1000 transitions using 10 leapfrog steps per transition would take 0.03 seconds.
## Chain 4: Adjust your expectations accordingly!
## Chain 4:
## Chain 4:
## Chain 4: Iteration: 1 / 2000 [ 0%] (Warmup)
## Chain 4: Iteration: 200 / 2000 [ 10%] (Warmup)
## Chain 4: Iteration: 400 / 2000 [ 20%] (Warmup)
## Chain 4: Iteration: 600 / 2000 [ 30%] (Warmup)
## Chain 4: Iteration: 800 / 2000 [ 40%] (Warmup)
## Chain 4: Iteration: 1000 / 2000 [ 50%] (Warmup)
## Chain 4: Iteration: 1001 / 2000 [ 50%] (Sampling)
## Chain 4: Iteration: 1200 / 2000 [ 60%] (Sampling)
## Chain 4: Iteration: 1400 / 2000 [ 70%] (Sampling)
## Chain 4: Iteration: 1600 / 2000 [ 80%] (Sampling)
## Chain 4: Iteration: 1800 / 2000 [ 90%] (Sampling)
## Chain 4: Iteration: 2000 / 2000 [100%] (Sampling)
## Chain 4:
## Chain 4: Elapsed Time: 0.030591 seconds (Warm-up)
## Chain 4: 0.0252 seconds (Sampling)
## Chain 4: 0.055791 seconds (Total)
## Chain 4:fit## Inference for Stan model: ex5.
## 4 chains, each with iter=2000; warmup=1000; thin=1;
## post-warmup draws per chain=1000, total post-warmup draws=4000.
##
## mean se_mean sd 2.5% 25% 50% 75% 97.5% n_eff Rhat
## mu1 -0.22 0.01 0.94 -2.07 -0.85 -0.23 0.40 1.68 4084 1
## mu2 1.63 0.01 0.82 0.04 1.09 1.62 2.15 3.25 4068 1
## sigma1 5.12 0.01 0.71 3.94 4.62 5.05 5.53 6.74 3863 1
## sigma2 3.63 0.01 0.64 2.66 3.18 3.55 3.98 5.08 3002 1
## lp__ -95.33 0.03 1.44 -98.86 -96.05 -95.04 -94.28 -93.52 1916 1
##
## Samples were drawn using NUTS(diag_e) at Mon May 18 16:52:15 2020.
## For each parameter, n_eff is a crude measure of effective sample size,
## and Rhat is the potential scale reduction factor on split chains (at
## convergence, Rhat=1).ms <- rstan::extract(fit)
prob <- mean(ms$mu1 < ms$mu2) #=> 0.93725
prob## [1] 0.9345